
Battery health
Batteries slowly lose capacity as they age. The Battery health dashboard shows how much energy each Marstek battery can still store, and how that changes over the weeks and months.
What the numbers mean
- Usable capacity is how much energy the battery can hold from 0% to 100% charge, in watt-hours (Wh) or kilowatt-hours (kWh).
- Battery state of health is that same figure as a percentage of the capacity printed on the battery (the nameplate, which the cards call the rating). At 95%, the battery holds 95% of its rating.
- Each card sums this up in a band: Healthy (90% or more), Fading (80% up to 90%) or Worn (below 80%). The bands describe fade only. The Open API reports no warranty terms.
- The band waits for evidence. It reads Measuring until charge and discharge runs both back the figure, and Uncertain while the battery's own charge-level counting drifts, or its runs disagree, too much to tell fade from measurement error.
Do you need to do anything? No. The estimate is calculated from readings Home Assistant already collects. It sends no extra requests to the battery and needs no cloud account. You choose only how you want to see it:
- Turn on the sidebar dashboard, or
- add the cards to a dashboard you already have, and optionally
- link a smart plug to measure round-trip efficiency and standby draw at the mains.
Why does it say Still measuring? Both numbers stay unknown until the battery has finished a few long charge or discharge runs. That can take days, and the band waits until it has seen both. Why that happens is explained further down.
The screenshots on this page are from a Home Assistant setup with a Venus E (3.0) that already has an estimate and a Venus A that is still collecting runs. Your device names, wattages, and dates will differ. A phone-width view of the same dashboard is in the visual tour.
What the dashboard shows
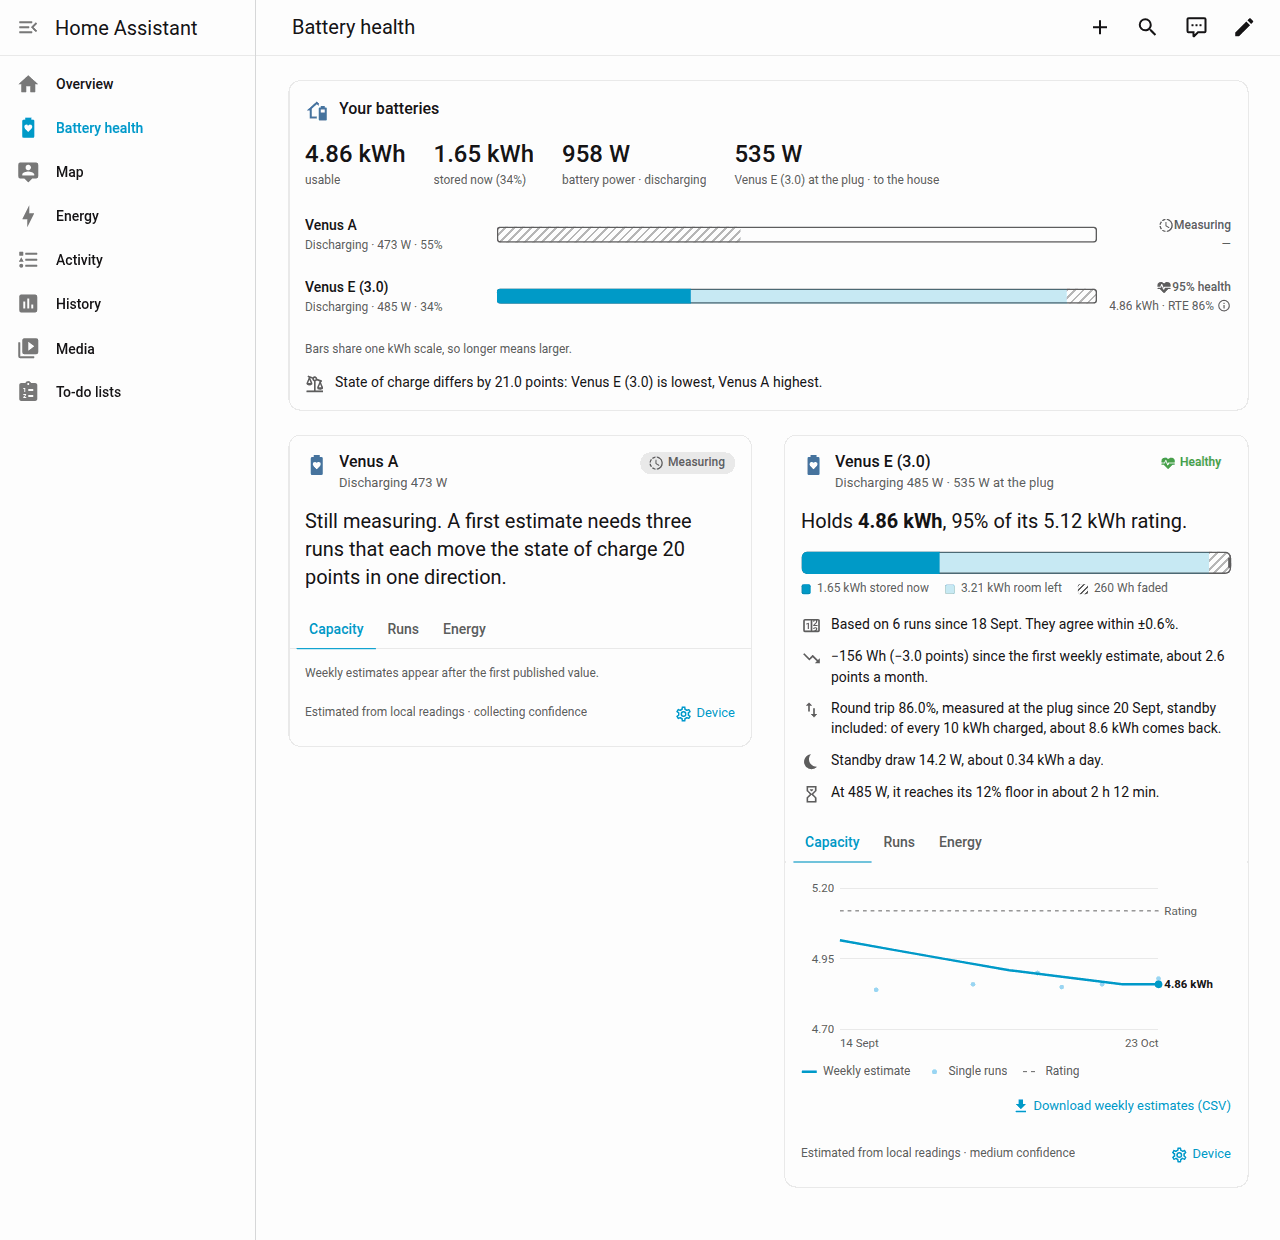
Your batteries adds up every Marstek battery on this Home Assistant:
- usable is the sum of the estimates.
- stored now is the energy in the batteries right now, with the combined state of charge in parentheses.
- While a battery has no estimate yet, both labels say how many batteries they cover, for example usable · 2 of 3 batteries.
- battery power is the combined charge or discharge power.
- at the plug appears once a smart plug is linked. The label names the battery whose plug reported that power.
The bars share one kWh scale, so a longer bar is a larger battery. A line under the bars points out a wide state-of-charge gap, the battery that holds the biggest share, a battery that has faded past the Healthy band, and a round trip at least 5 points below another battery of the same model.
Each battery card shows:
- The name, whether it is charging, discharging, or idle, and the live watts. With a plug linked, the plug's watts sit on the same line.
- A band on the right: Healthy (90% or more), Fading (80% up to 90%), Worn (below 80%), Measuring until charge and discharge runs both back the estimate, or Uncertain while the charge-level drift is 5% or more or the runs scatter by 10% or more. A battery that reports no rating, such as the Venus E mini, gets no band.
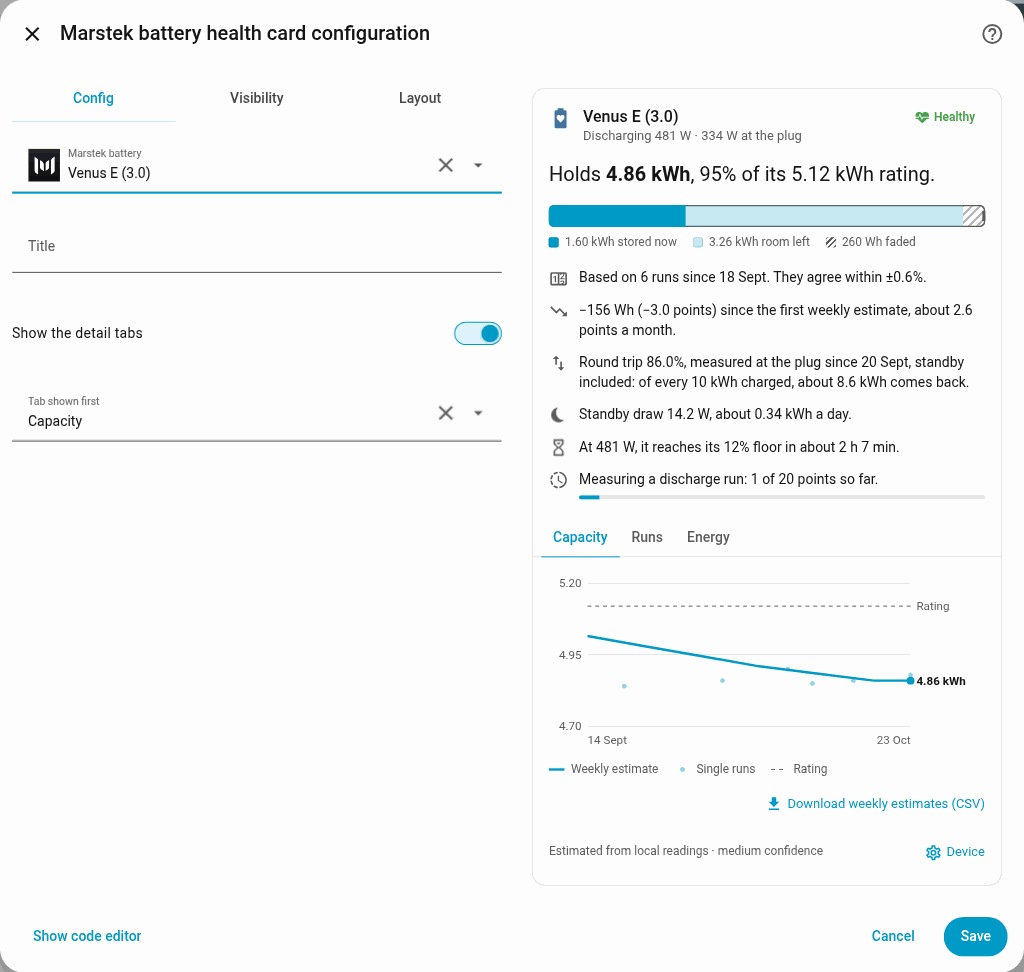
- One sentence that says what the battery holds against its rating. On the screenshot, Venus E holds 4.86 kWh, 95% of its 5.12 kWh rating. While only one direction has runs, the sentence starts with First estimate, from discharge runs only (or charge runs), because that figure still leans on an assumed conversion loss.
- A bar split into energy stored now, room left, and the part that has faded. The faded part appears only with a measured band and when the gap to the rating is wider than the runs disagree.
- Short insights: how many runs the number is based on and how closely they agree (half of them lie within the stated percentage of the median), how much the weekly estimate has moved, what the round trip means per 10 kWh charged, the usual standby draw at the plug when one is linked, and how long the battery can keep going at the current power.
- A footer with the confidence and, when something holds it down, the reason: runs in one direction only, runs that disagree, charge and discharge power that differ widely, mostly solar-charged runs, or charge-level drift.
While the battery is discharging at 50 W or more, that last time runs down to the floor set by Depth of discharge. An 88% depth of discharge stops the battery at 12%, and the sentence names that floor. The Open API cannot read the setting back, so the card uses the last value written from Home Assistant, which starts at 88%. The time allows for the same 0.93 conversion loss the estimate uses, plus 20 W the unit spends on itself while it charges or discharges: a discharge draws more from the cells than reaches the AC side, and a charge stores less than it takes in. Part-load tests put that own draw at about 5 W on a Venus E mini and about 30 W on a Venus A, so at 100 W the time can be about 12% short or 8% long. From 500 W the error is 3% or less.
Capacity
The Capacity tab is the weekly chart: a line for the weekly estimate, a dot for each run, and a dashed line for the rating. The chart appears after the first published estimate. Venus A is still measuring on the screenshot, so it shows the empty state. A note under the chart says what the figure measures: watt-hours per 100% of the charge level the battery reports. Download weekly estimates (CSV) saves week_start, usable_wh, rated_wh (the rating that week), and method (how the estimate was calculated; see Formula).
Runs
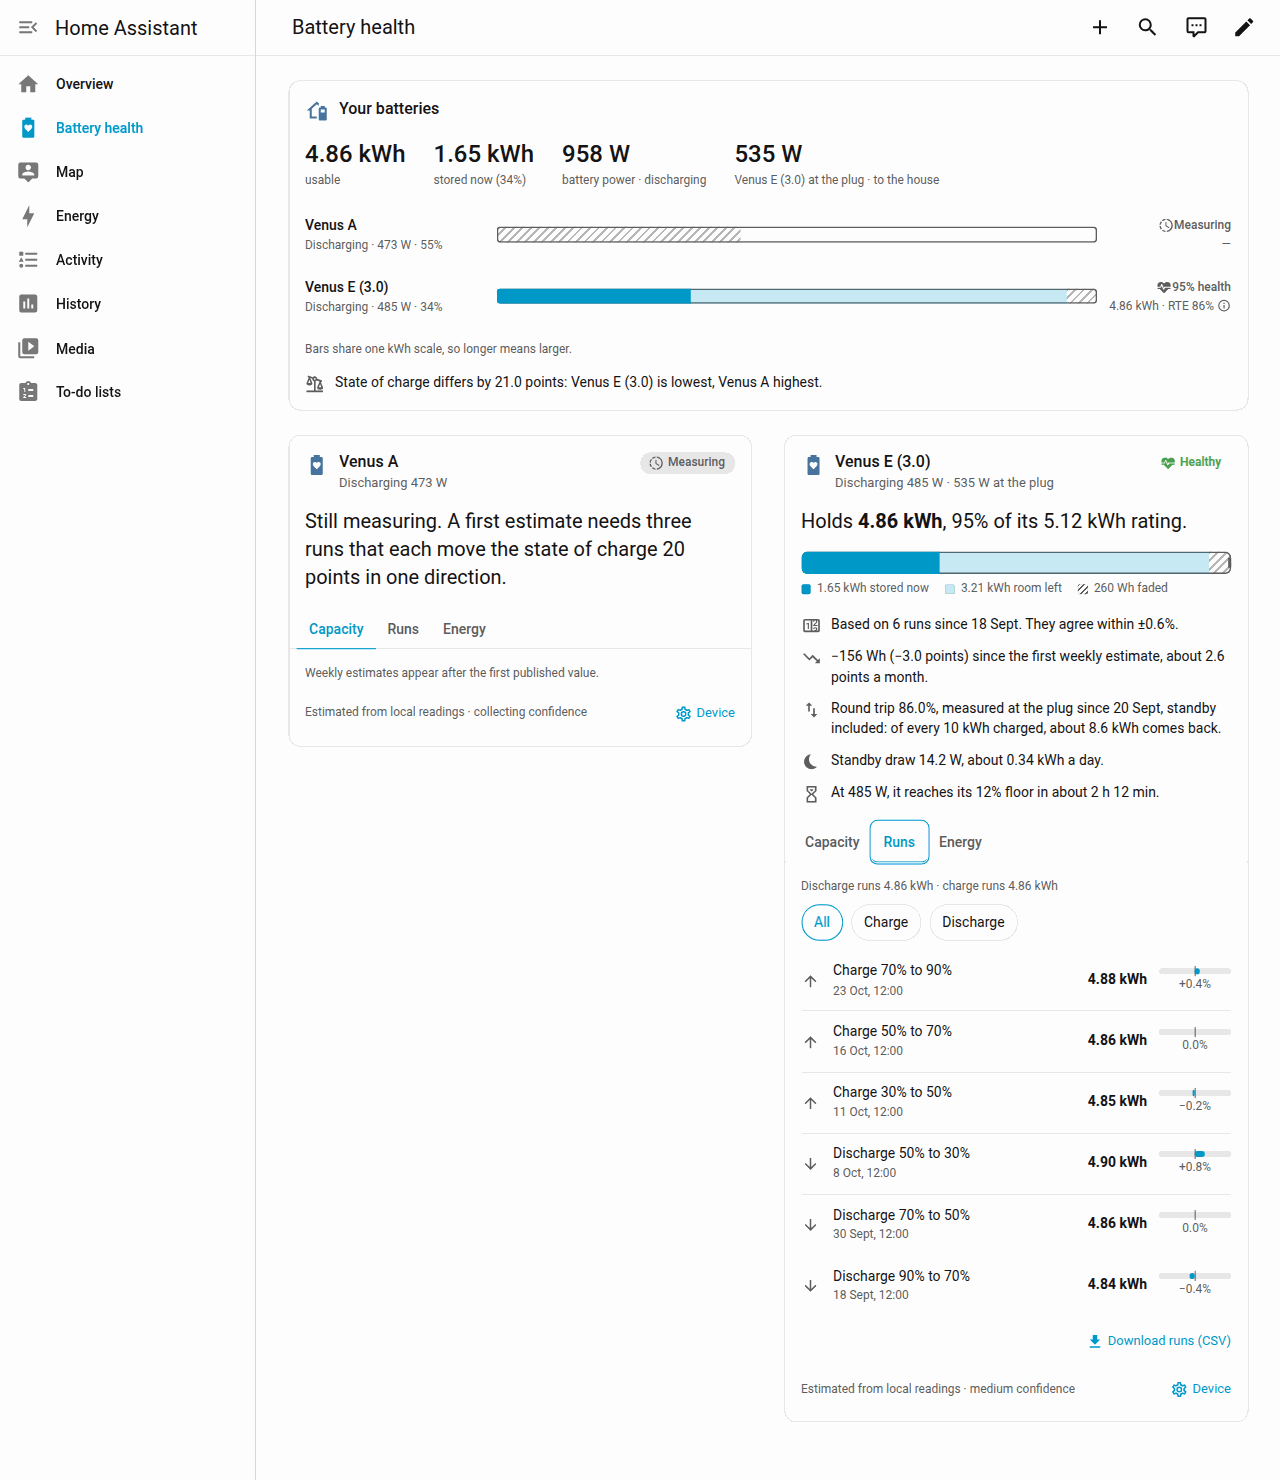
A run is one stretch of charging or discharging that moved the state of charge by about 20 points. Runs lists every kept run, newest first, eight to a page, with Newer and Older buttons. Filter with All, Charge, or Discharge.
Each row shows the run's capacity and how far it sits from the median for that direction. The median is the middle value, so one odd run does not pull it off. The line above the list gives the median of the discharge runs and the median of the charge runs. Download runs (CSV) saves every kept run, including ones hidden by the filter.
Energy
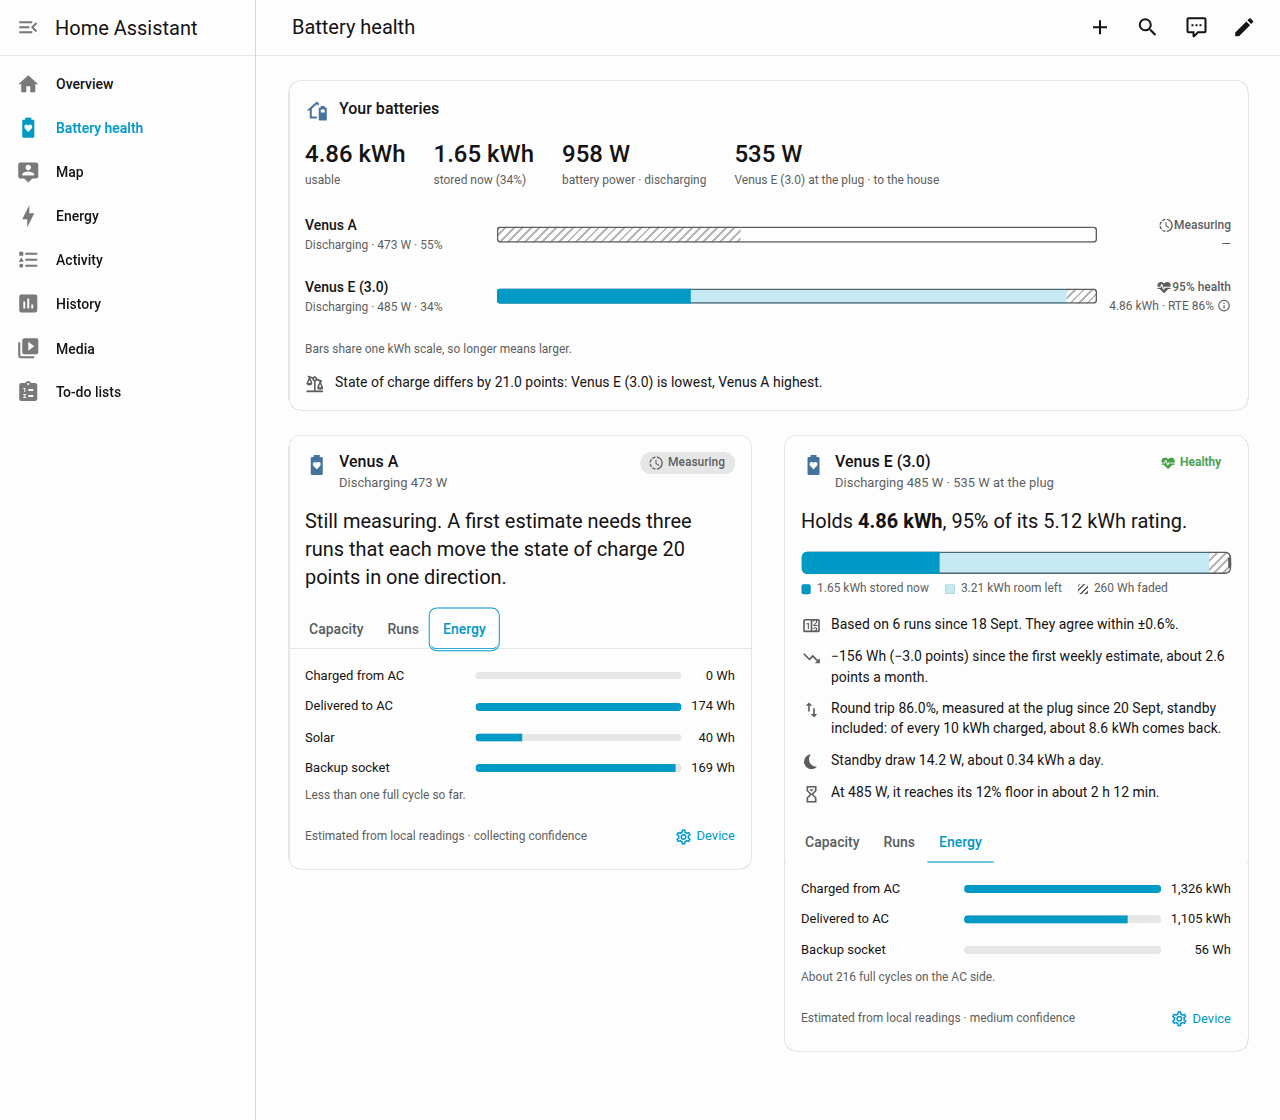
Energy is lifetime energy the battery has already counted:
- Charged from AC and Delivered to AC are the grid-side totals.
- Solar appears on models that report solar (PV) energy, such as Venus A and Venus D.
- Backup socket appears once the off-grid output has delivered some energy. On the screenshot Venus E's backup socket has barely been used, next to a long AC history. Venus A shows both Solar and Backup socket.
- Full cycles are the energy delivered to AC divided by the nameplate. Below one nameplate of delivered energy, the card says less than one full cycle.
Restarts
Restarts lists the device restarts, brief network resets and network dropouts of the last 30 days, newest first. Why a battery goes offline explains each kind in plain language.
- Rows are grouped under a heading per day (Today, Yesterday, then the date) with a count of each kind for that day.
- A line above the list gives the 30-day totals, or the totals since tracking started while that is less than 30 days ago.
- Each row names its kind next to its icon, with its time. A second line says how long the battery was offline and what showed the restart: energy totals restored, CT meter disconnected, mode changed, or the start-up test at a linked plug. A restart that fell between two polls says so instead of an offline time.
- A brief network reset row explains in one sentence that the battery dropped off the network for a few seconds and ran its start-up check without restarting. A dropout row says there was no sign of a restart.
- Like Runs, the log shows eight rows to a page, with Newer and Older buttons and the range on screen, so the card keeps its height on a dashboard. A day that runs onto the next page keeps its heading and its count there.
- With no outage in 30 days the tab says so. With the Restarts sensor disabled, it says to enable it.
Download restarts (CSV) saves at, kind, offline_s, failed_polls, and evidence (trace names separated by ;). How the kinds are told apart is in Restarts and dropouts.
Corrections
The battery works out its charge level by counting the energy that goes in and out. Small counting errors add up, and the battery corrects its percentage when it reaches full. Corrections lists the newest ten of those corrections, newest first. You do not need to act on them. They show how far a single run can be off.
One line above the list counts corrections and full charges in the last 30 days and gives the last full charge. Every arrival at 100% counts as a full charge. Only one with enough polls on the way up can be checked for a correction, so when some could not, the line adds how many were checked, for example (3 checked). If the battery has not been full for more than 14 days, it says so, and a battery that has not been full since tracking began says that instead. A second line says how far a single run can be off and, at 2% or more, how much that lowers the confidence in the estimate. Past 30% it only says the drift is larger than that, because a figure that size comes from a glitch rather than from counting.
With two or more corrections, a bar strip shows them oldest to newest. A bar above the line means the battery had counted short; below it, it had counted long. Taller bars are larger corrections, so a strip that grows means the counting drifts further between full charges.
Each row names the kind next to its icon, with the signed size on the right:
- Jumped up: the percentage stepped up in one go, usually to 100%.
- Climbed fast: it caught up over a few polls, faster than the charging power explains.
- Held near full: it waited near 100% while the battery kept charging.
- Dropped: it fell in one step the battery's power does not explain.
The second line gives the date and time, and what share the correction is of the points the percentage moved since the previous full charge. A step that did not end at 100% also shows both levels (60% → 52%). A correction that ends at full shows no starting level: the estimator judges the last 15 points before 100%, so that start says nothing about where the jump began.
What these corrections mean opens a short explanation of each kind and of why LFP batteries correct near full. Download corrections (CSV) saves at, style, from_soc, to_soc, points, and throughput. How a correction is found is in Charge-level corrections near 100%.
Turn on the sidebar dashboard
The sidebar page is off until you enable it. The cards themselves stay available from Add card either way.
- Go to Settings > Devices & services > Marstek.
- Open the device and choose Configure.
- Open Battery health dashboard.
- Turn on Show Battery health in the sidebar and submit.
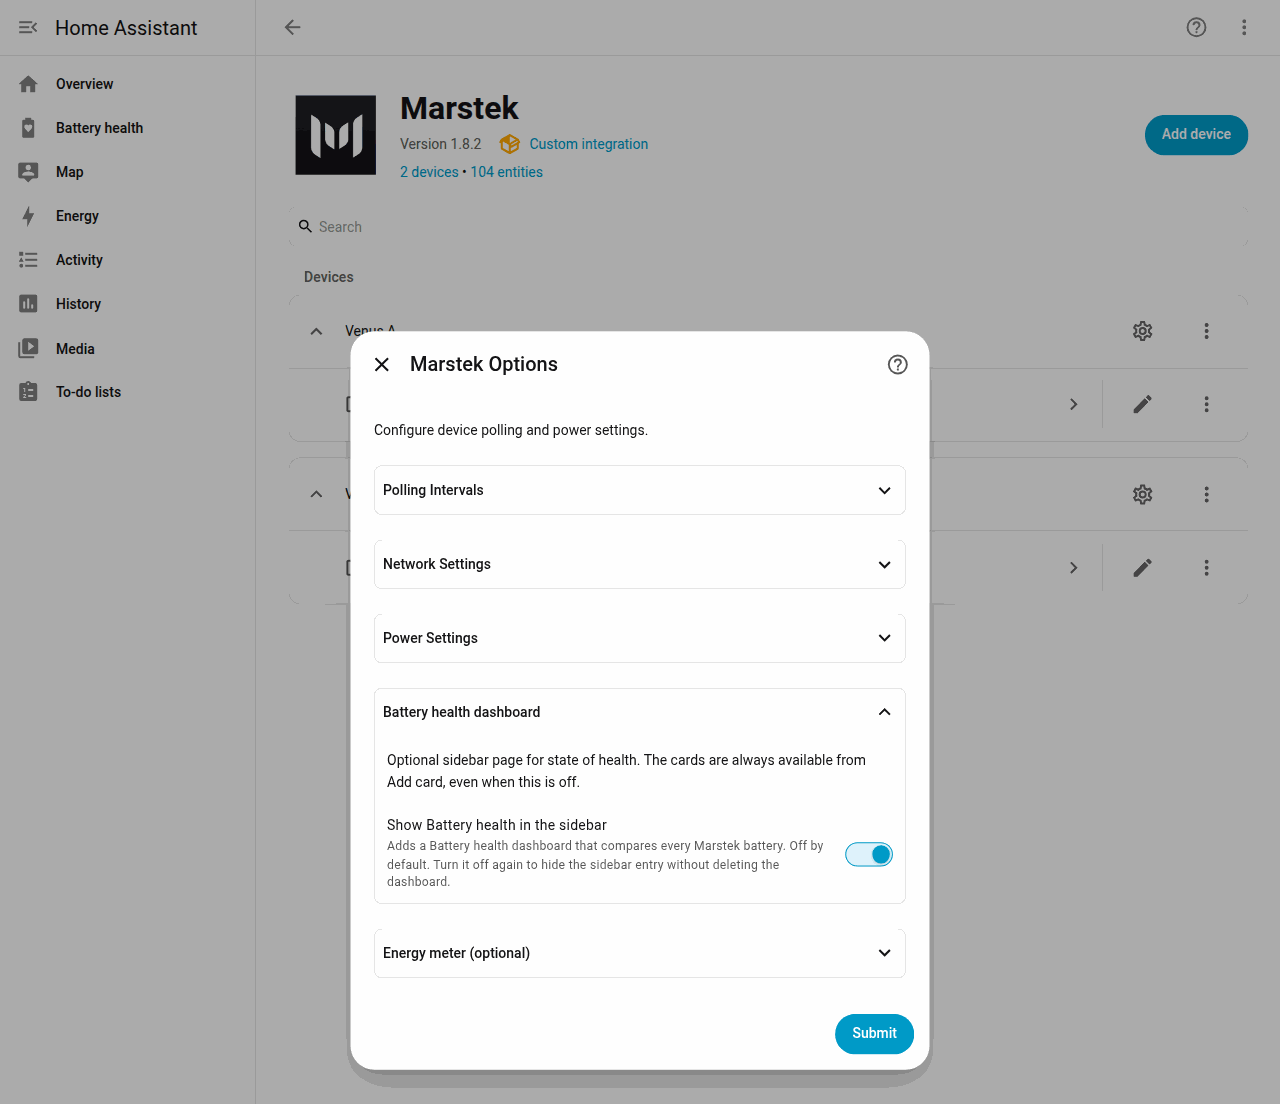
Home Assistant adds a Battery health entry to the sidebar (in Dutch, Batterijgezondheid). It places Your batteries across the top and one card per battery below it. If the sidebar entry does not show up after you submit, reload the browser. Turning the option off again hides the sidebar entry and leaves the dashboard in place.
Add the cards to a dashboard you already have
The integration registers the cards itself, so they show up in the card picker after a browser reload. You pick them like any other card. For state of charge, power, and solar, use Home Assistant's own cards. See Dashboard cards.
- Install or upgrade the integration, then reload the browser.
- Open your dashboard, choose Edit dashboard, then Add card.
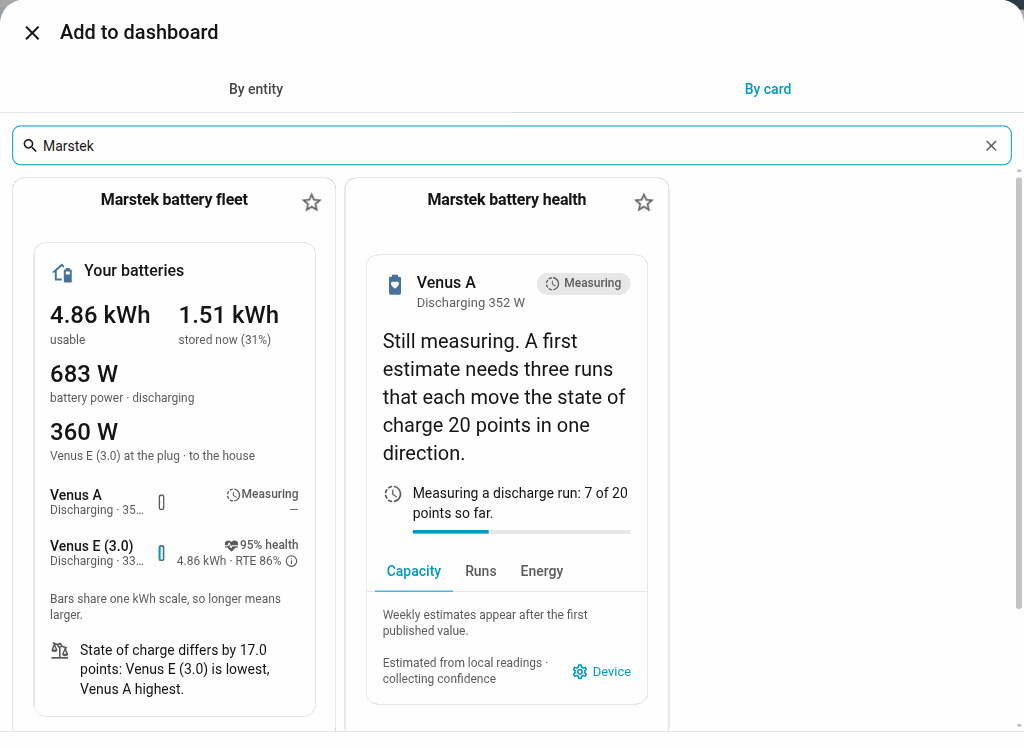
- Open the By card tab.
- Type
Marstekin Search cards, or scroll down to Custom cards. - Pick Marstek battery health for one battery, or Marstek battery fleet to compare all of them.
The visual editor sets the battery, an optional title, whether the detail tabs show, and which tab opens first.
If you edit YAML, the card types are custom:marstek-battery-health-card and custom:marstek-battery-fleet-card. The picker lists those English names in every language. The words on the card follow your Home Assistant language. English and Dutch are included.
Clicking a row on the fleet card opens that battery's more-info dialog.
To be notified when a battery leaves the Healthy band, use a numeric state trigger on Battery state of health. The sensor changes only when the estimate changes, so the automation fires rarely:
triggers:
  - trigger: numeric_state
    entity_id: sensor.venus_e_3_0_battery_state_of_health
    below: 90
actions:
  - action: notify.notify
    data:
      message: >-
        {{ state_attr(trigger.entity_id, 'friendly_name') }} is at
        {{ trigger.to_state.state }}% of its rating.
Use below: 80 for the Worn band. The card rounds to a whole percent, so the automation can fire a few tenths before the card changes band.
Link a smart plug
The battery does not report the power it draws to stay awake. A plug or meter that sits only between this battery and the mains sees that energy too. HomeWizard Energy Socket and Shelly plugs both work, and so does any meter with two total-energy sensors.
- On the plug's device page, enable the sensor that counts energy leaving the battery. On a HomeWizard socket that sensor is Energy export. Home Assistant creates it disabled until the socket has exported, or until you enable it yourself. Energy import is the energy going into the battery.
- Go to Settings > Devices & services > Marstek > your battery > Configure.
- Open Energy meter (optional).
- Set Energy into the battery and Energy out of the battery. Fill both, or leave both empty. They have to be two different sensors.
- Submit.
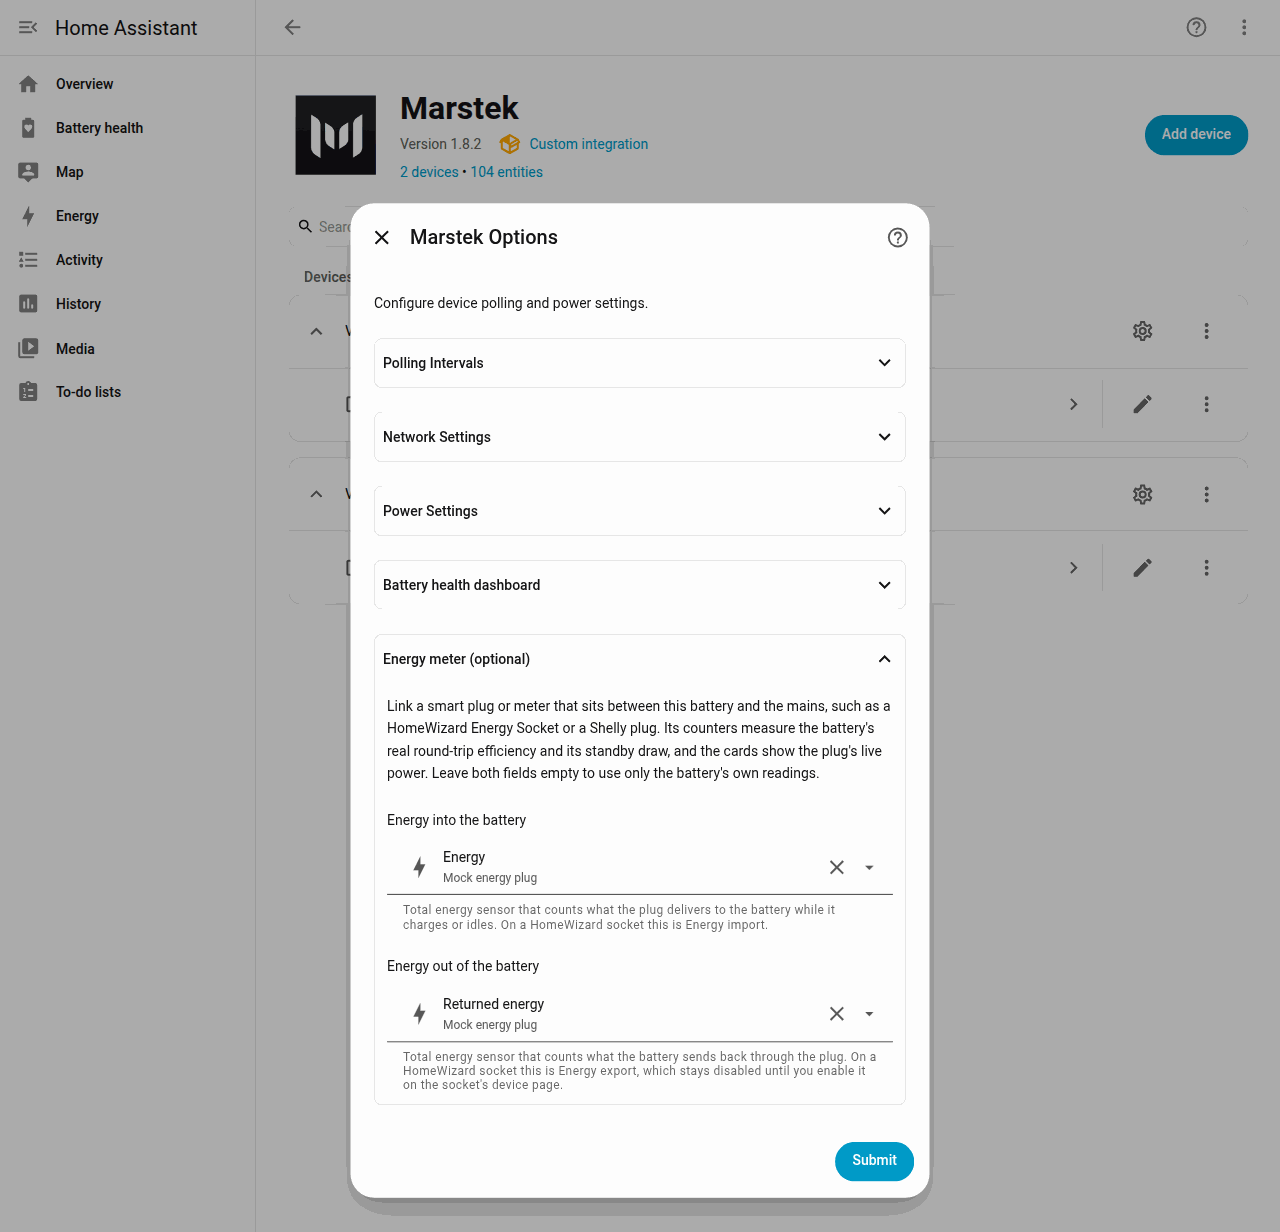
The screenshot uses a lab meter named Mock energy plug. On a HomeWizard socket you pick Energy import and Energy export.
With a meter linked, the cards add:
- The plug's live watts, on the health card under the battery name and as at the plug on Your batteries. The plug updates on its own schedule, so its watts can differ from the battery's 30-second reading.
- Round-trip efficiency measured at the plug, standby included. Round-trip efficiency is how much of the energy you charge comes back out. The sentence says "measured at the plug" and spells out what comes back from every 10 kWh charged.
- Standby draw: the usual reading at the plug while the battery is idle, in watts and in kWh a day at that rate. Wake pulses and short charges are not part of it.
To keep using only the battery's own readings, leave both fields empty. The round trip then says it was estimated from those readings, and standby is left out.
Why does my card say Still measuring?
A first estimate needs three runs in one direction. A run is one stretch of charging, or one stretch of discharging, that moves the state of charge by 20 points. A long pause, a mode change, or the power dropping to a trickle ends the stretch before it counts.
A discharge from 70% to 50% is one run. Three discharges like that publish a number. So do three charges. Two charges and one discharge do not, because the two directions are kept separate until each has three runs. After that, the published number blends both.
Until then the card stays on Measuring. A line under the sentence counts the runs so far, for example "So far: 1 of 3 discharge runs, 2 of 3 charge runs." While a run is open, it shows how far the run has got, for example "3 of 20 points so far." A battery that only trickles, or that changes direction often, can take days. Weekly estimates appear after the first published value.
Once one direction has three runs, the card shows that first figure as First estimate, from discharge runs only (or charge runs). It converts AC watt-hours to the battery side with an assumed loss, so it can sit a few percent off. The band stays on Measuring until the other direction also has three runs, because the blend of both is what cancels that assumption.
How it works under the hood
You can stop at the sections above if you only want to use the dashboard and the cards. The rest of this page is for readers who want the calculation, the stored history, and the limits. It uses the integration's own terms: a window is what the cards call a run, and SoC is the state of charge.
The Usable capacity sensor estimates how much energy the battery can store per 100 points of reported state of charge, in watt-hours. It is not the energy inside the SYS depth-of-discharge setting. It is also not the figure Marstek Capacity Monitor publishes after scaling a full discharge to that band. Battery state of health is the estimate divided by the nameplate (ES.GetStatus bat_cap), in percent. Both stay unknown until there is enough evidence. Neither one adds a UDP request.
battery_power is an AC-side wattage, measured on the mains side of the inverter. On Venus E 3.0, Venus A, and Venus D the Open API usually omits bat_power, and the entity is ongrid_power + offgrid_power - pv_power (positive discharges). Do not feed that entity to a tool that wants DC battery power. Using it there counts inverter losses as battery energy, which is why Marstek Capacity Monitor warns when you pick an AC power sensor.
Home Assistant keeps long-term statistics for both sensors. Usable capacity uses device_class: energy_storage and state_class: measurement, a combination that stores a mean, minimum, and maximum, not a sum. The unit is Wh, which the entity settings can display as kWh. State of health is a percentage with the same measurement statistics. last_reset is not set, because Core rejects it for any state class other than total.
Sources: Home Assistant Core 2026.9.3 (the devcontainer image)
SensorDeviceClass.ENERGY_STORAGEis "stored energy" and explicitly includes "the capacity of a battery". Its only allowed state class ismeasurement, and its unit converter is the energy converter (Wh,kWh, and the otherUnitOfEnergymembers).DEFAULT_STATISTICSmapsmeasurementto mean, min, and max.SensorStateClass.MEASUREMENTis "a measurement in present time".- Setting
last_resetoutsidestate_class: totalraises (sensor/__init__.pyin that same Core tag). - Accepted windows are kept in a
Storekeyed by config entry (marstek.usable_capacity.<entry_id>, version 1).
What the device actually reports
The estimate uses only three readings from the battery: its state of charge, its power and its operating mode. The battery reports other capacity figures too, but none of them measures fade.
Used:
- State of charge (
bat_soc, fromES.GetStatuson the fast poll), usually a whole percent. - Battery power:
bat_powerwhen the firmware sends it, otherwisepv_power - ongrid_power - offgrid_power. This is the AC-side wattage the integration already publishes (positive = discharging). - Operating mode (
ES.GetMode), only to discard a window that changes mode. - Nameplate (
bat_cap, fromES.GetStatus), for state of health on families where it is the pack size. It is not used as the estimate.
Not used:
bat_capacity,rated_capacity, temperature and charge flags (Bat.GetStatus). The call stays off unless a diagnostic entity is enabled, and on some firmwares it is suspected of resetting the device. Those watt-hours are the BMS's own remaining and rated figures, not a measured fade. (The BMS is the battery management system inside the pack.)- Lifetime grid, PV and load energy (
ES.GetStatus). They count energy at the inverter's AC side, including conversion losses, not charge into the pack. - Cycle count, cell voltage and BMS state of health. These are not in the Open API, and the integration does not invent them.
Venus E mini reports remaining energy in bat_cap, so the integration does not treat it as a nameplate. Usable capacity is still estimated. State of health is not created.
Formula
In short: the integration adds up the energy that went in or out while the state of charge moved at least 20 points, then scales that to 100 points. For example, a discharge that delivers 1,000 Wh at the AC side while the state of charge falls 20 points gives 1,000 / 0.93 / 0.20 ≈ 5,376 Wh.
A window is one direction (charge or discharge), one mode, and no long gap between polls. Power below 150 W for more than two polls in a row, or a change of direction, ends the window. When the state of charge has moved at least 20 points and the window has at least four samples:
DC watt-hours = AC watt-hours / 0.93     while discharging
DC watt-hours = AC watt-hours * 0.93     while charging
capacity = DC watt-hours / (state-of-charge change / 100)
AC watt-hours are the trapezoidal integral of the reported battery power between polls: the average of two readings times the time between them, added up. The 0.93 one-way factor is the same model the mock battery uses. It is not a measurement from Marstek hardware, and Marstek states only a maximum efficiency with no load condition. Independent tests of the Venus E 3.0 measured round trips of about 80 to 85% (heise, technikblog.ch, energienerds, techtest.org), which is about 0.88 to 0.92 one way, standby included. The factor exists so a charge window and a discharge window describe the same DC pack. Without it they disagree by about the square of the efficiency, and a healthy nameplate would look faded.
Gap limit and where a window starts
At the default 30 second poll the gap limit is 180 seconds. The options flow allows a fast poll up to 300 seconds, and Home Assistant starts that wait after the poll has finished, so a slow setting would step past 180 seconds on every successful poll. The limit then becomes the configured interval plus 150 seconds, which is how long one poll can spend on its own requests (six serial reads at the maximum 30 second delay). A missed poll is another full interval and still ends the window. Raising the constant to 300 seconds instead would let a 30 second poll stitch across a five-minute hole.
The window starts on the first poll after the reported state of charge changes, not on whatever poll opened it. It is accepted on the poll that completes a 20-point move, which is also the first poll after a change, so both ends sit the same distance past a step.
On Venus A and Venus D that reported battery power is an energy balance, pv_power - ongrid_power - offgrid_power in the API sign. pv_power is PV charging power from the MPPT (the solar charge controller), on the battery side of the inverter (Open API note, sections 3.5 and 3.6.1). It does not take the 0.93 factor. Only the AC port does:
# ac: derived reading, Home Assistant sign
ac = battery_power + pv_power
# when the AC port is exporting or idle
dc = ac / 0.93 - pv_power
# when the AC port is importing
dc = ac * 0.93 - pv_power
With pv_power at 0 this is the formula above. Venus E 3.0 omits bat_power and reports pv_power 0, so its windows do not move. A device that actually sends bat_power stays on the whole-reading formula; that field is not split, because the Open API does not say whether it is DC. A whole window of PV-only charging used to be about 7% low (× 0.93). The share of the battery-power integral that PV covered is stored as pv_share (0 to 1).
A state-of-charge step of two points or more ends the window when the watts of that poll, the nameplate, and one extra point of slack cannot explain it. A single whole-percent step never does. The usual cause is a BMS recalibration, often near 100%. Without a nameplate the check uses a 300 Wh pack, so only a jump that small pack could not make is dropped. Venus E mini has no nameplate in this field.
Such a step waits up to two polls before it counts. If one of those polls is nearer the level before the step than the level after it, and the watts explain the move from that earlier level, the step was a glitched reading: it is dropped, nothing is recorded, and the open window carries on as if it had not happened. If the third poll still sits near the new level, the step is real, and the held polls are folded in order. A spike can also rise by a step the floor allows and fall back by more. When a step the watts cannot explain lands near the level before the poll it left, that poll was the spike: the step counts as an ordinary move, and the spike's reading is set back to the earlier level, so it neither moves the end of the open window nor reads as a correction on the next arrival at 100%. The linked plug's round trip does not anchor on a poll that is still waiting. Polls more than 120 seconds apart are a different case: the watts at the two ends cannot rule out a load spike between them, so a step there ends the window without being recorded as a correction. With a fast interval above 60 seconds, a glitch that lasts two polls spans more than the gap limit from the poll before it to the one after, so it also ends the window, still without a correction.
From windows to one number. The sensor publishes a number only when one direction has three windows. It keeps the newest 21 in each direction, so a long run of discharge windows cannot push out the charge windows. Two charge windows plus two discharge windows stay unknown: the directions are not pooled into one median.
- With three windows in only one direction, the number is that direction's median, and it still depends on the 0.93 factor.
- Once charge and discharge each have three windows, the number is the geometric mean of the two medians. If the real charge and discharge efficiencies are equal, that product cancels the factor, including the case where 0.93 is wrong. What remains is the square root of
η_discharge / η_charge, plus any steady auxiliary draw the AC port has in both directions.
A window outside 300–30,000 Wh, or outside 15–135% of the nameplate when one is known, is dropped. The median is what ignores a single bad stretch. There is no second outlier rule, because one would freeze the value if the pack really did fade.
Two attributes describe how far the windows that entered the published number disagree. windows_used counts them; charge windows are not among them while only the discharge median is published.
run_scatter_pctis the median absolute deviation of each direction from its own median, as a percentage of that median, and the larger of the two. Half the windows lie within it. This is the figure the card prints.spread_whis the full range of each direction relative to its own median, the larger of the two, times the published value.
Neither counts the gap between the charge and the discharge median: in the geometric mean that gap is an efficiency offset, not disagreement. Both are observed spreads, not confidence intervals. The choice of method, and the error margin that goes with it, is written up in Capacity estimation methods.
Confidence. The label starts from how many windows entered the number: fewer than 6 is low, fewer than 12 medium, 12 or more high. Nothing published is collecting. Five checks can each lower it, and confidence_limits names the ones that did:
| Check | Lowers to | When |
|---|---|---|
single_direction | medium | Only one direction's median is published, so the 0.93 factor is still in it. |
run_scatter | medium, low | run_scatter_pct is 5% or more; 10% or more lowers to low. |
power_asymmetry | medium, low | In the geometric mean, one direction ran at 4 or more times the other's median watts. At 6 times with an implied round trip below 0.80, it lowers to low. Inverters lose more at low power, so the two efficiencies differ and the mean no longer cancels them. |
solar_charging | medium | PV covered at least half the battery watts in most charge windows (at least three of them know their share). A PV reading error passes straight into those windows. |
soc_drift | medium, low | soc_drift_bound_pct is 2% or more; 5% or more lowers to low. |
The thresholds come from a simulation campaign across device families, seasons, inverter curves, poll faults and BMS errors. They mark where the window count alone labelled an error too confidently. They are not a calibrated error bar.
A new nameplate. bat_cap has to report a new value on three polls in a row before it is used, so a single glitched reading moves nothing. A change of more than 10%, such as an added expansion module, is a different pack: the stored windows are cleared, the open window ends, and the estimate starts again from Measuring. Runs of the old pack would otherwise read as wear on the new one. A smaller change keeps the windows and only moves state of health. The nameplate is stored with the windows, so a change while Home Assistant was down is still noticed. Each weekly point carries the nameplate and method of that week, and the card's trend compares only weeks with the same method and a nameplate within 10% of the latest.
State of health is estimate / bat_cap * 100, rounded to 0.1. It can sit a little above 100% when the efficiency assumption is low.
Sensor attributes and stored windows
Attributes (not stored in long-term statistics, only the state is): method, windows accepted, confidence (collecting, low, medium, high), the 20-point minimum, the 0.93 factor, which treatment produced the number (discharge_median, charge_median, charge_discharge_geometric_mean, or assumed_one_way while still collecting), nameplate, and the last window's direction, capacity, and time. Once a direction has a window, its median is discharge_median_wh or charge_median_wh.
Once each direction has three windows, implied_round_trip_efficiency is 0.93 × 0.93 × discharge_median / charge_median. That is the round-trip efficiency the two medians imply when the readings are AC and the assumed factor is the only thing that differs between them. It is a diagnostic, not a measured efficiency, and a PV-heavy window moves it. The card shows it only between 50 and 100%. Confidence, with confidence_limits, is described under Formula. It is not a calibrated error bar.
Home Assistant writes a state row when attributes change, so attributes that move on every poll do not belong on a sensor (sensor attributes). These change when a window is accepted.
Each accepted window is stored with its start and end state of charge, average reported power, duration, mode, and pv_share. A store written before those fields existed still loads; the missing fields stay absent. The storage version is unchanged.
Charge-level corrections near 100%
LFP (lithium iron phosphate) cells hold an almost flat voltage between about 20% and 95%, so their voltage says little about how full they are. The BMS therefore counts charge in and out to know its state of charge. Small counting errors add up until the cells reach full, where the BMS learns the truth and resets the percentage. That reset shows up in three ways:
- Jump. The counter ran low: 92, 95 or 97% goes straight to 100%.
- Creep. The same, spread over a few polls of one or two points.
- Hold. The counter ran high: the percentage sits at 99% while the battery keeps charging, then reaches 100%.
A correction does not rescale or discard the runs before it. Instead it feeds a drift figure, soc_drift_bound_pct: the corrected points divided by the points the percentage moved, pooled over the last eight checked full charges plus every checked full charge of the last 30 days, and published once at least 100 points have moved. The 30 days keep a correction the card still names inside the figure. At 2% or more it caps the confidence at medium, at 5% or more at low. The Corrections tab shows it as how far a single run can be off.
How a correction is measured
The estimator records each arrival at 100% as a full charge and moves last_full_charge_at. Only an arrival whose last 15 points the trace covers is judged; a gap longer than the gap limit on the way up, from lost polls or a restart, leaves it unjudged, and full_charges_checked_30d counts the judged ones apart. The store keeps the last poll and the trace from its latest point at or below 85%, and Home Assistant writes it as it stops, so a restart that leaves the polls on either side within the gap limit keeps the climb. With a published capacity it compares the points the percentage moved on the last 15 or more points before full with the points the measured watt-hours explain. The size is the largest difference between any point of that approach and full, so a hold counts from where the reading reached 99. A step mid-range that the per-poll check already flagged is not counted again on arrival.
A hold must also survive the unit's own draw. The reported watts leave out what the unit uses itself, and a charge that tapers near full can spend much of its power there, so every charging second is allowed some watts of it before the difference counts. Runs of polls at one reading are kept as their two ends, so a slow solar charge or a long hold still fits the trace.
Once three charge windows are accepted, it converts those watt-hours with their median rather than the published value. The charge median is what the BMS itself counts per point, so the difference is the whole correction whichever direction miscounted, and the efficiency assumption drops out. A difference under three points is an ordinary full charge. Without a published capacity, only a step the watts cannot explain counts. A hold also ends the open window, because the watt-hours charged at a frozen 99% belong to no percentage.
A correction does not say which way to correct the runs. A charge counter that misses charge and a discharge counter that over-counts both end in an upward jump, yet they bias the two direction medians in opposite directions.
How close the drift figure is to the error depends on which counter drifted:
- One direction. The figure is about the error, as long as the counter resyncs at full. Simulated packs with a charge or a discharge counter 2 to 8% off land within a point of it when the BMS holds at 99% until the cells are full. A charge counter that over-counts and stops charging at its own 100% never resyncs: the figure stays at zero, the estimate reads 2 to 3% low, and the implied round trip reads 3 to 5 points high.
- Both, opposite ways. The geometric mean cancels most of the error, so the figure warns more than it needs to.
- Both, the same way. A BMS that divides by a stale capacity counts every point too large or too small in both directions. Its count still agrees at full, so nothing is corrected and the figure stays at zero while the estimate is off by the full mismatch. Only a discharge to the cutoff, where the BMS resets to empty, shows it.
Attributes: soc_corrections (the newest ten, card only, not recorded), soc_corrections_30d, full_charges_30d, full_charges_checked_30d, last_full_charge_at, soc_tracking_since (when the tracker started watching, so the card can tell "never full" from "just started"), and soc_drift_bound_pct. The card names the latest correction and the bound, and a bound above 30% only as "more than ±30%". When the battery has not reached 100% in 14 days, or not since tracking began 14 or more days ago, it says so instead: without a full charge the drift has no point to reset at.
A linked smart plug compares charge in and charge out between two moments at the same percentage. After a correction the same percentage is no longer the same energy, so the plug round trip drops the levels it was holding and starts again from the next one.
A BMS that divides its counter by the nameplate instead of the faded capacity never jumps. Its percentage then says nothing about fade, and no correction will show it. Where such a counter does reset, at empty or at full, the corrections push the drift figure up; at 5% or more the card shows the band as Uncertain and leaves out the faded part. The note under the Capacity chart says the figure is per 100% of the charge level the battery reports, which is the most it can say without an outside meter.
Restarts and dropouts
The Restarts sensor counts how often the battery restarted in the last 30 days, and the battery health card lists each one on its Restarts tab. Some units restart on their own every few hours or days, also with the Local API enabled (Venus E 3.0 on Control 150 included). A restart takes about 30 seconds to a minute.
The battery does not report restarts itself. The Open API has no uptime and no boot counter (Open API note). So the integration looks for the traces a boot leaves behind. An outage with none of them is a dropout: the network lost the battery, but it kept running. Many dropouts point at the network.
The traces it looks for:
- Energy totals restored. At boot the Control firmware writes its stored lifetime counters back to the inverter (firmware emulator notes, CAN command 0x16/0x17). Energy counted since the last save is lost, so a raw
ES.GetStatustotal comes back lower than the previous reply. Nothing else makes these totals fall, so this counts even when no poll failed: a 30-second reboot fits between two 30-second polls. The comparison uses the raw reply, before the grid-total floors described in Troubleshooting. - Boot self-test at the plug, with a linked smart plug. As it boots, the unit runs the same test at its mains cord every time: the standby draw (about 8 W) disappears, then it imports about 2.5 kW for 5 to 35 seconds, then the plug reads 0 W again before standby returns. Some tests start with an export of about 1.25 kW. One owner's plug showed this 37 times in ten days, about every 5 hours, by day and by night. A charge never starts or ends from a reading below standby and lasts longer than a minute, so the test is not mistaken for one. On its own the test is not enough; see brief network resets.
- CT meter lost and mode changed, as reported after resets in #14. These count only when the device was unreachable in between, because while it answers, a user or a flaky CT can change them on their own.
When the device answers again after an outage, the outage is a restart if one of these traces came with it, and a dropout otherwise. Dropouts with no restart point at the network, and the tab says so.
When to look twice. A router or access point that reboots can leave a trace without a battery restart. If the CT meter shares that Wi-Fi, it can drop off while the battery is unreachable, and that outage then counts as a restart. A self-test seen at the plug, or energy totals restored, settle it. The tab lists every trace, so a restart backed only by CT meter disconnected is worth a second look.
Technical details
- The plug test is read from the plug's power sensor (the one on the same device as the linked energy sensors), and nothing is sent to the battery. The test counts at the next good poll, together with any other trace from the same boot.
- Late Wi-Fi is not an outage. On Venus A, D and E 3.0 with firmware 150 or newer, and Venus E mini with firmware 301, the client sends a read again after 0.5, 2.5 and 5 seconds, so a reply the Wi-Fi module dropped is recovered inside the same poll and never reaches the sensor. Older firmware and HMG-50 (Venus C) get no retransmit, so one lost reply there is already a failed poll. A poll that still gets no reply opens an outage.
- What a restart cannot show without a plug: if the unit saved its counters just before it went down and the CT reconnected before the next poll, there is nothing left to see, and a short reboot counts as a dropout or not at all. A linked plug closes most of that gap. How often a real unit saves its counters is not known.
- An outage still open when Home Assistant restarts or the integration reloads is not counted, because the last good poll it is measured from is not stored.
Brief network resets
The plug's self-test also follows something smaller than a restart. Control 150 and 151 (and Venus A 1508 and 1509) reset their own network chip while cloud uploads keep failing: the Ethernet chip about every 35 minutes, the Wi-Fi module anywhere from a few minutes to about half an hour apart (firmware notes). The battery leaves the network for 5 to 10 seconds and asks the router for an address again. The plug shows the same start-up check, but the battery's energy totals, CT link and mode are untouched. It keeps its last output until the meter data returns about a minute later. All the kinds of outage are compared in Why a battery goes offline. Control 151 lists fixes for failing uploads.
So a self-test with no other trace, and at most one failed poll, is listed as a brief network reset and is not added to the Restarts count. A full restart keeps the unit away for 30 seconds to a minute; it misses two polls or more, or restores its energy totals, and still counts. A full restart that misses only one poll and leaves nothing but the self-test is listed as a brief network reset. Logs stored before this split are relabelled when they load, and the count drops by the entries that changed.
Many brief network resets in a row mean the battery cannot reach the Marstek cloud. Check the firewall, DNS filter or VLAN it sits behind.
Limits
- The estimate is only as good as the device's state of charge. If the BMS counts that percentage against a fixed nameplate, this calculation recovers that scale. Chemical fade shows up when the reported percentage moves differently from the energy that actually left the pack, which is what a voltage recalibration or a drifted charge counter does. It will not reveal fade the BMS is hiding by stretching its own percentage.
- The battery's own watts set the scale. The estimate is the energy the battery reports divided by the points its percentage moved. A power reading 3% low made the estimate about 3.6% low at high confidence in simulation, and nothing in the readings can show it. A linked smart plug measures the round trip independently but does not correct the capacity.
- State of charge is coarse: whole percents. Starting on a step keeps a 20-point window from being a point off, which was about 5% on that window. What remains is how far the state of charge moves in one poll: a quarter point at 1 kW on a 5 kWh pack and a 30 second poll, about 1% on one window. The cost is that a run must move 21 points to yield a 20-point window. This is not a lab measurement.
- One direction depends on the 0.93 factor. With only discharge windows, or only charge windows, the absolute watt-hours move if the real one-way efficiency is not 0.93. The long-term slope is still the degradation signal. Once both directions have three windows, the geometric mean removes a factor that is shared by both directions. A remaining gap between the two medians means the two efficiencies are not equal, and that gap is the residual
sqrt(η_discharge / η_charge). Inverters lose more at low power, so a pack charged fast and discharged slowly keeps some of that residual; confidence drops when the two powers differ widely. - Self-consumption pulls the two directions apart. The unit's own draw is not in the reported watts. It makes discharge windows read low and charge windows read high. At equal power the two cancel in the geometric mean: 15 W at 800 W both ways gave −1.6% and +2.0%, and −0.2% published, in simulation. At unequal power a residual of about −1.5% to +2.6% remains. The implied round trip carries both errors, so it moves more than the estimate.
- Solar-charged runs inherit the PV reading. On Venus A and Venus D the battery watts are derived, and PV watts enter on the battery side with no conversion loss. A PV reading 5% high made the estimate about 4% high in simulation. When most charge windows ran on PV, confidence is at most medium.
- A new battery may read above 100%. The pack can hold more than its nameplate. heise measured 4.83 kWh from 100% to 11% on a Venus E 3.0, about 6% above the 5.12 kWh rating per 100 points before conversion (heise). That is one test. If it holds, a pack reads Healthy until it has lost that margin plus 10%, so watch the weekly trend as well as the band.
- Depth of discharge is not applied. The number is watt-hours per 100 state-of-charge points. SYS depth of discharge (30–88, default 88) is not applied. Rev 3.1 has
DOD.SETand no read (Open API note, section 3.8), and the number entity is the last successful write, not a measurement. A within-DoD watt-hour attribute would publish that guess, so it is not there. Marstek Capacity Monitor's figure is the energy of a full discharge scaled to its depth-of-discharge band, which is a smaller number than watt-hours per 100 points. - A missed status reply is not a sample. If
ES.GetStatusdid not answer,ES.GetModecan still bring a new state of charge while battery power is the previous poll's watts, so that pair is skipped. The open window stays open, and the next answered poll is measured from the last good one, as long as the gap is still inside the limit above. The power sensor still shows the carried watts. - Some stretches never count. Idle, short cycles, mode changes, and gaps longer than the limit above are ignored. A battery that only trickles may take days to publish a number.
- No extra polling is added. Disabling the two entities in the registry hides them. The arithmetic still runs on data the coordinator already fetched, which is a few numbers per poll and no UDP.
Energy meter (optional)
The steps to link a meter are in Link a smart plug. This section is how those numbers are calculated.
The battery reports its own AC power, but not the power it draws to stay awake. Owners report a round trip of roughly 83% to 85% and an idle draw of a few watts on the Venus E 3.0, below what the spec sheet suggests. A smart plug between the battery and the mains (a HomeWizard Energy Socket, a Shelly plug, or any meter with total energy sensors) sees both.
Configure > Energy meter (optional) links two total energy sensors: energy into the battery and energy out of it. On a HomeWizard socket these are Energy import and Energy export. Home Assistant creates the export sensor disabled while the socket has never exported, so enable it on the socket's device page first. HomeWizard also shows a counter that is exactly zero as unknown; that only delays the first measurement. Leave both fields empty to use only the battery's readings; then nothing below runs.
How it is measured:
- At the same state of charge the pack holds the same energy, so the quotient of energy out and energy in needs no efficiency assumption. Standby draw and self-discharge in between are included, which is why it is lower than
implied_round_trip_efficiency. - The integration remembers the first meter reading at each whole state of charge for 30 days. When the pack is back at a remembered level after at least one full capacity went in, it publishes the quotient, at most once a day, and only when the result is between 50% and 100% efficiency.
- Solar or off-grid power above 20 W reaches the pack without crossing the plug, so such a poll starts the measurement again. So does a counter that went down, or a different pair of sensors.
- Standby draw is the usual power the plug shows while the battery is idle, which is what the plug reads most of the time. It is not the average of every watt-hour over that stretch. A wake pulse (the boot self-test, a fan) or a short charge between polls adds energy the battery does not report as power, and that average then sits about twice the watts on the plug. The 1 Wh steps of a kWh counter are not the cause: a steady 9 W still totals about 9 W.
- Idle means three hours or more, 5 W or less of reported battery power, and no energy out. A reported charge or discharge ends the stretch. A poll with no battery power, or a missing meter reading, leaves it open. A hole longer than two hours starts again, so a charge missed while the battery was offline is not counted.
- When the plug has a power sensor on the same device, the figure is the median of those readings over the idle stretch. Without one, each ten minutes of the import counter is a rate. Blocks that hold a pulse or a charge are set aside, and the mean of the rest is published. It is published when the stretch ends, and once a day while it lasts. Anything above 100 W is dropped.
- A stored standby from before this rule is an average. It is dropped on the next start and measured again, so an old 18 W does not stay on the card. The daily figure on the card is this usual reading times 24 hours, not the plug's total overnight consumption.
- Load: the two energy sensors and, when the plug has one, its power sensor are read from memory on the poll the integration already makes. There is no extra polling, and the Store is written only when a published number changes.
The cards prefer the measured round trip to the implied one and say so ("at the plug"). The health card adds the usual standby draw in watts and in kWh a day at that rate. When the plug has a power sensor on the same device, the cards also show its live watts: on the health card, in the line under the battery name, and as a fourth figure on the fleet card. The plug's figure is sampled on its own schedule (every 5 s for HomeWizard), so it can differ from the battery's 30-second reading by more than the conversion loss.
Attributes the meter adds to the usable capacity sensor
plug_energy_entities: the two linked sensors, so the cards can find the plug's power sensor.plug_round_trip_efficiency: energy out divided by energy in, between two moments at the same state of charge.plug_round_trip_since,plug_round_trip_at: start and end of that measurement.plug_round_trip_energy_in_wh,plug_round_trip_energy_out_wh: the two counters' differences.plug_standby_w: the usual plug watts while the battery is idle, over a stretch of at least three hours. Wake pulses and short charges are left out. With a power sensor on the plug, this is the median of those readings. Without one, it is the mean of the ten-minute import rates that are not pulses.plug_standby_at: when that standby figure was taken.
Lovelace cards
How to add the cards is in Add the cards to a dashboard you already have. This section is what they read and where the history is stored.
The integration serves its own frontend module, marstek-battery-health.js, so no Lovelace resource is needed. After upgrading, reload the browser (or restart Home Assistant), then pick a card under Add card. The cards call an accepted window a run: one stretch of charging or discharging that moved the state of charge far enough to count. The rating is the nameplate the device reports (bat_cap).
Marstek battery health (custom:marstek-battery-health-card) shows one battery:
- The header puts the name and the live power flow on the left, and the band on the top right: Healthy (90% or more), Fading (80% to 90%), Worn (below 80%), Measuring while there is no estimate or it rests on one direction only (
collectingconfidence, or adischarge_medianorcharge_medianmethod), or Uncertain whilesoc_drift_bound_pctis 5 or more orrun_scatter_pctis 10 or more. A pack without a nameplate gets no band. The band uses the same rounded percentage the card shows. The bands describe fade only; the Open API reports no warranty terms. - A sentence under the header states what the pack holds against its rating, prefixed First estimate, from discharge runs only (or charge) while one direction backs it. A battery-shaped bar splits the rating into energy stored now, room left, and the faded part. The faded part needs a measured band and a gap to the rating larger than
run_scatter_pct(at least 1%) of the rating; "at least its full rating" appears only when the estimate reaches the rating. - Short insights say how many runs back the number and how closely they agree (
run_scatter_pct), and whether capacity moved more than that spread since the first weekly estimate (once 28 days of estimates exist). The trend compares only weeks with the latest week's method and a nameplate within 10% of it, so the switch from one median to the geometric mean, or an added module, is not read as a change in the pack. They also say what the round trip means per 10 kWh charged, how long the pack can keep discharging (or how long until full) at the current power when it is 50 W or more, and how far an open run has got. Those times convert the AC watts with the same 0.93 one-way factor as the estimate and allow 20 W for the unit's own draw. The footer gives the confidence and theconfidence_limitsbehind it. - While discharging, that time runs to the floor set by the Depth of discharge number (an 88% depth of discharge stops the pack at 12%), and the sentence names the floor. The Open API cannot read that setting back, so the number is the last value written from Home Assistant (88% until then). Without that entity (older firmware), the card assumes the firmware's default of 88%, so the time still runs to 12% and never to 0%.
- Five tabs hold the detail: Capacity (weekly estimates with each run as a dot and the rating as a dashed line), Runs (every kept run, newest first, eight to a page, filterable by direction, each with its deviation from the median for its direction), Energy (lifetime AC in and out, solar when the battery has a solar counter, the backup socket when it has delivered energy, and equivalent full cycles), Restarts (the device restarts and network dropouts of the last 30 days by day, newest first), and Corrections (the newest ten times the battery reset its own charge level).
- The Capacity tab can download the weekly estimates as a CSV file (
week_start,usable_wh,rated_wh,method).rated_whis the nameplate recorded that week, and the current one for weeks stored before it was recorded;methodis empty for those older weeks. The Runs tab can download every kept run, whatever the filter shows (closed_at,direction,start_soc,end_soc,soc_delta,capacity_wh,duration_s,average_power_w,pv_share). Times are UTC in ISO 8601 and cells are comma-separated. A value a run did not record (an older run, or no solar share) leaves its cell empty.
Marstek battery fleet (custom:marstek-battery-fleet-card) compares every battery:
- It totals usable capacity, stored energy, and battery power, and draws each pack on one kWh scale, so a longer bar is a larger battery. While some packs have no estimate, the usable and stored labels and the share line say how many batteries they cover ("2 of 3 batteries").
- It points out the battery with the largest share, the most faded one once its measured band is Fading or Worn, a round-trip gap of 5 points or more between packs of the same model (measured at the plug or implied, never one against the other), and a state-of-charge gap of 10 points or more.
- Each row's round trip has an info icon whose tooltip says whether it was measured at the plug (standby included) or estimated from the battery's own readings.
- Selecting a row opens that battery's more-info dialog.
The health card's visual editor sets the device, a title, whether the tabs show, and which tab opens first. The card picker lists both cards by their English names in every language; the card text follows your language.
To be told when a battery leaves the Healthy band, use the automation in Add the cards to a dashboard you already have. It triggers on the Battery state of health sensor, which moves only when the capacity estimate moves.
Configure > Battery health dashboard / Dashboard batterijgezondheid adds a sidebar dashboard (marstek-battery-health, strategy custom:marstek-battery-health) titled Battery health or Batterijgezondheid. It places the fleet card across the full width and one health card per battery below it. It is off until you enable it. Turning it off hides the sidebar entry and leaves the dashboard in place.
What the cards read and where history is stored
The cards read the windows, history, active_window and soc_corrections attributes of the usable capacity sensor; the state of health sensor leaves them out. They change only when a run is accepted, the estimate moves, a new week starts, or state of charge moves during a run, so a poll that changes nothing writes no new state. history holds week_start (a unix time) and usable_wh for each week, plus rated_wh and method for weeks recorded since those were stored; the full weekly points stay in the Store file below. active_window holds the direction, started_at, the start and current state of charge, and the progress toward the 20-point threshold. The recorder skips all four attributes, because the cards only need their current value.
Accepted windows stay in .storage/marstek.usable_capacity.<entry_id> with history: one point per ISO week (156 weeks kept). Each point stores the week, month, usable watt-hours, both medians, implied round-trip efficiency, equivalent cycles, the nameplate and method, and the lifetime grid, PV, and load watt-hours known at that time. The store also keeps the confirmed nameplate, the last poll, and the correction trace from its latest point at or below 85%, written again as Home Assistant stops. A store written before history existed still loads.
Testing with the mock device
The mock can run a faded pack with --capacity-wh (physics) while bat_cap stays at the family nameplate. --soc-cycle holds Passive mode between 30% and 92%. --time-scale speeds the physics and the reported inverter watts by the same factor so a wall-clock integrator still sees the true capacity. The default scale is 1. On Venus A and Venus D the mock credits MPPT watts to the pack directly and runs only ongrid_power through the one-way factor, the same split as the estimator, so a PV-only window lands on the true pack watt-hours. Venus E 3.0 and Venus C have no device PV, so that split does not move them.